9483
AiS
Session 4a
Joshua
Foster
Agenda
- MobLab: In-class Simulation.
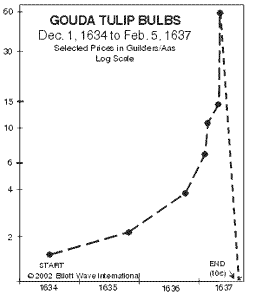
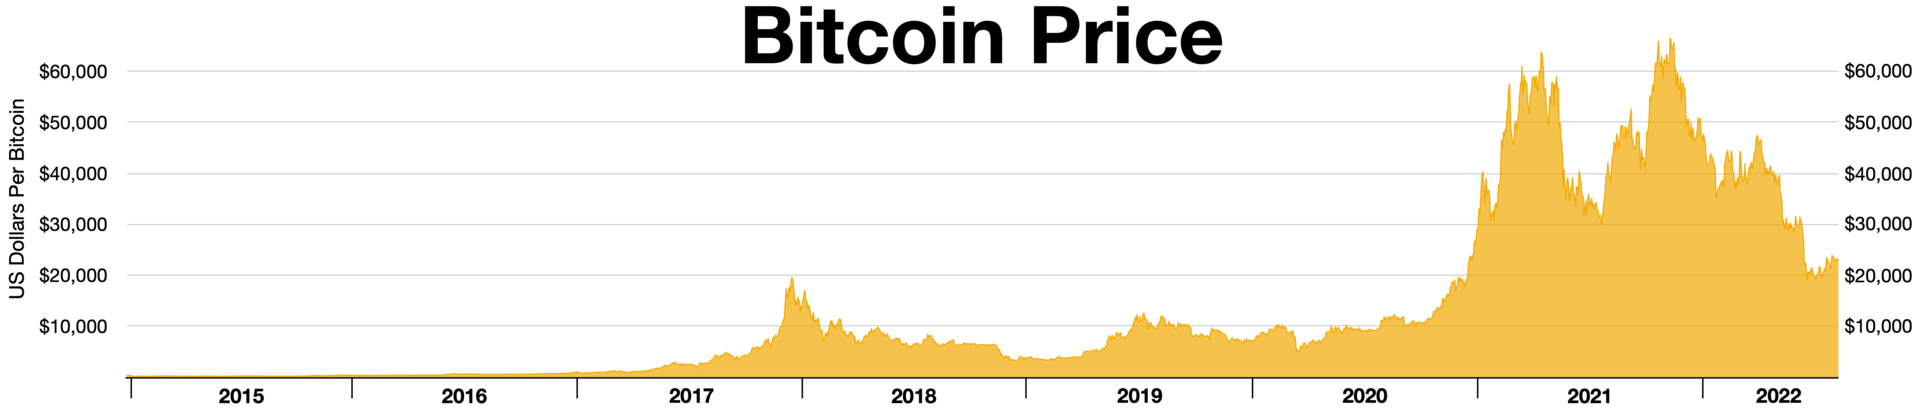
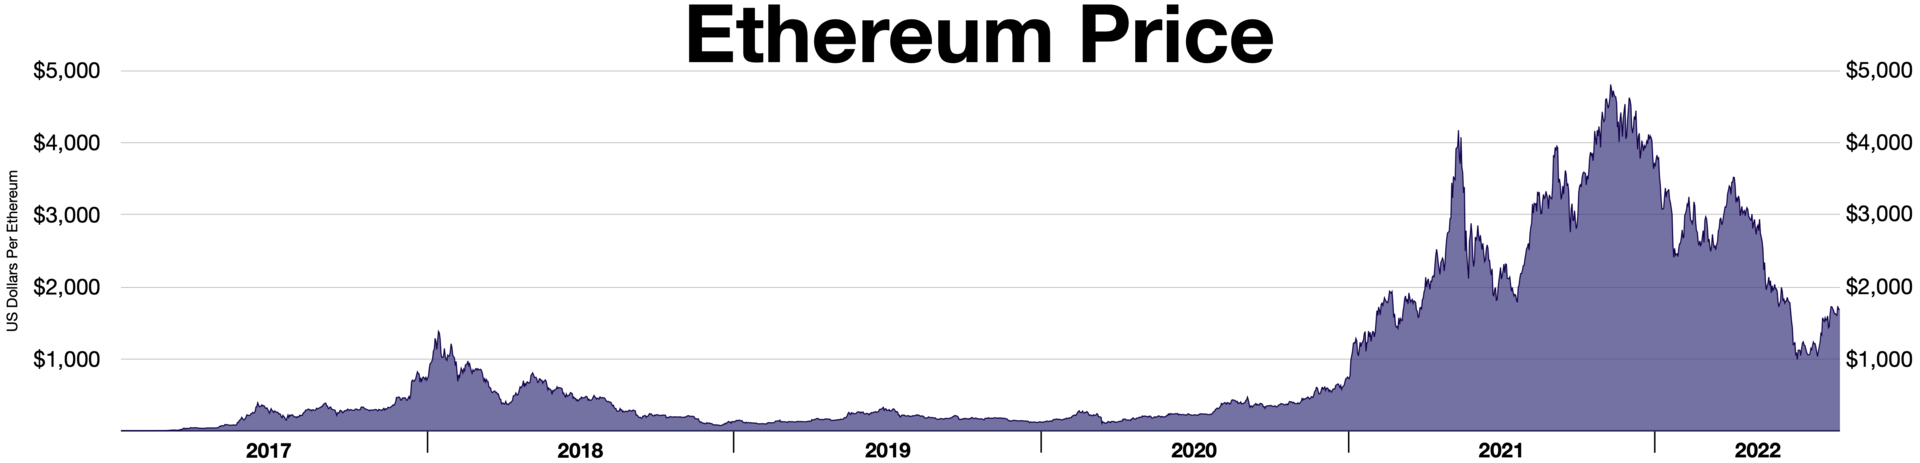
- Behavioural Economics of Asset Pricing.
"... day-to-day fluctuations in the profits of existing investments, which are obviously of an ephemeral and nonsignificant character, tend to have an altogether excessive, and even an absurd, influence on the market."
- John Maynard Keynes, The General Theory of Employment, Interest and Money (1936)
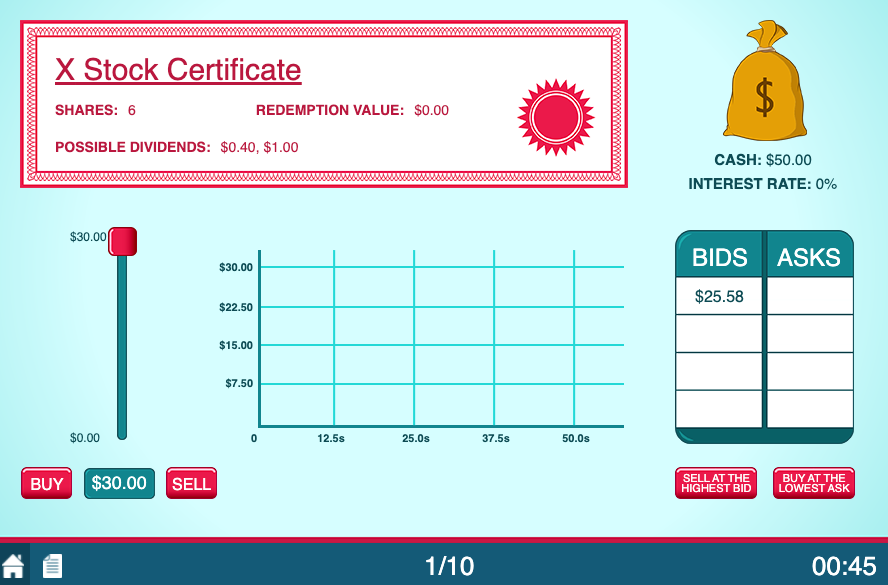
Simulation instructions.
- The situation: there is a market that trades shares of "Stock X", an asset that periodically pays out dividends to its owners.
- What you do: buy and sell shares of "Stock X" with each other over the course of 10 dividend periods to produce investment returns for yourself.
- Your objective: finish the simulation (10 periods of trading) with the most cash possible.
How it works.
- Everyone starts the simulation with 6 shares of "Stock X" and $\$$50 in cash.
- Trading begins in the first dividend period (10 total).
- To make an offer to buy a share of "Stock X" you will place a Bid in the market.
- To make an offer to sell a share of "Stock X" you will place an Ask in the market.
- When the computer finds a Bid$\geq$Ask in the market it will automatically trigger a trade.
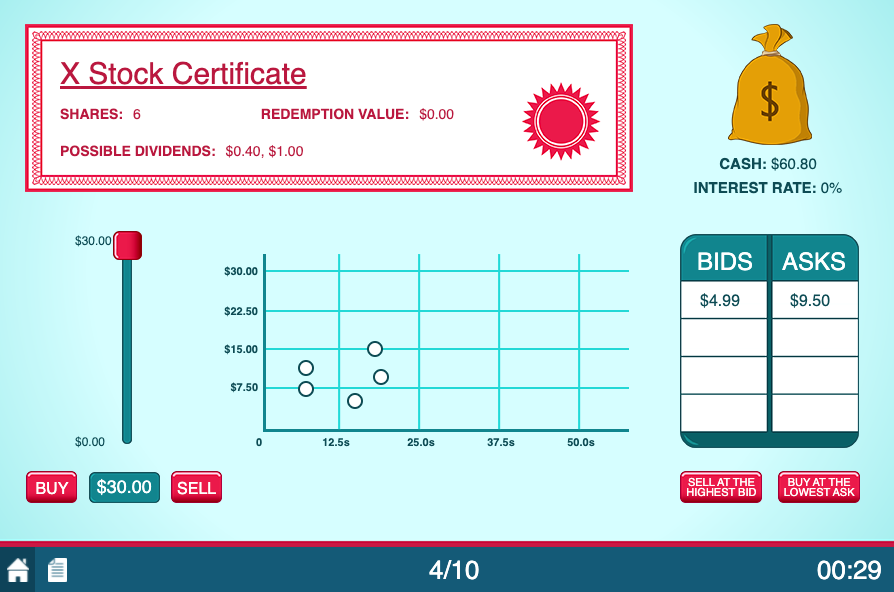
How you make money.
- Dividends paid on the shares of "Stock X" you own.
- Price received on the shares of "Stock X" you sell.
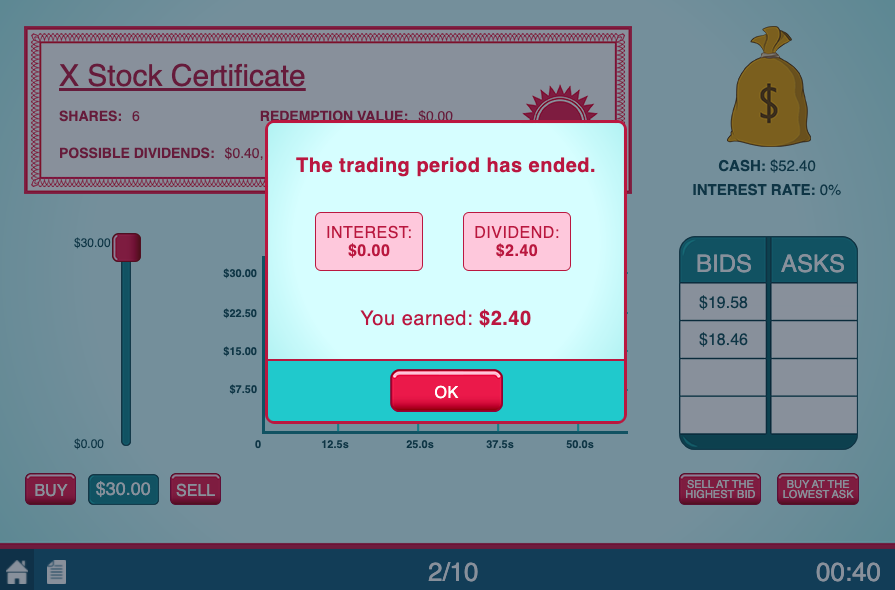
How you make money (cont.).
- At the end of each period, a dividend is distributed to those who own shares of "Stock X".
- The dividend will either be $\$$0.4 (50%) or $\$$1 (50%).
- Example: if you own 5 shares of "Stock X" at the end of a period and the dividend is randomly $\$$1, then you would earn $5\cdot\$1=\$5$ as a return for that period.
How you make money (cont.).
- Once dividends are paid out the next period begins and trading resumes.
- Dividends are calculated randomly once more
(either $\$$0.4 or $\$$1 per share). - This repeats for a total of 10 dividend periods, during which your returns accumulate.
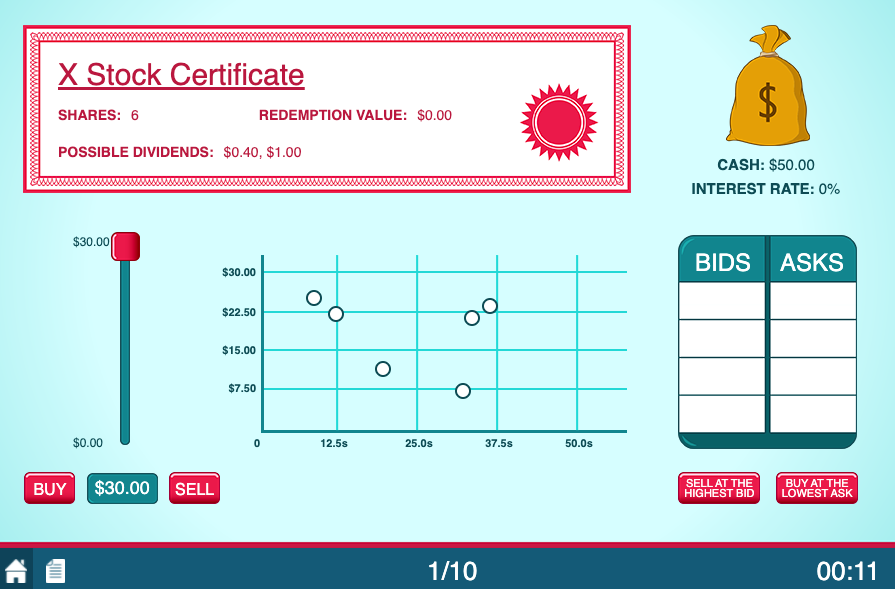
Some important facts about this market.
- Shares of "Stock X" are worthless at the end of the simulation ($\$$0 redemption value).
- You may only place a Bid if you have the cash on hand, and likewise you may only place an Ask if you have a share of "Stock X" to sell.
- Each trading period lasts for 50 seconds.
To summarize:
- Everyone gets 6 shares and $\$$50 to start.
- There will be a total of 10 trading periods (50s each).
- A dividend is randomly paid out ($\$$0.4 or $\$$1 per share) at the end of each period.
- Your earnings accumulate throughout the simulation.
- "Stock X" has $\$$0 redemption value when the simulation ends.
Questions?
What is the rational pricing strategy for "Stock X"?
How can we relate this simulation's results to mistakes in naturally occurring asset markets?
One more MobLab Simulation.
Pick a number $X\in\{0,1,2,3,...,100\}$.
Objective: get closest to $\frac{2}{3}$ of the group's average.
Example: If you believe $\bar{X}=100\Rightarrow X^*=67$.
What is the rational way to play this game?
Level-k reasoning.
Individuals devise strategies according to their beliefs about others' rationality.
What are the primary assumptions regarding how financial markets operate?
| 1) | |
| 2) | |
| 3) | |
Equity premium puzzle.
Equity returns outperformed bond returns by 4% on average from 1871-1993 (Campbell and Cochrane, 1999).
From Mehra and Prescott (1985):
- Investor objective: maximize $E[\sum_{t=0}^{\infty}\beta^{t}U(c_{t})]$
- Assume $U(c,\eta)=\frac{c^{1-\eta}-1}{1-\eta}$
- Empirically impute $\eta$ to be $\approx 30$-$40$
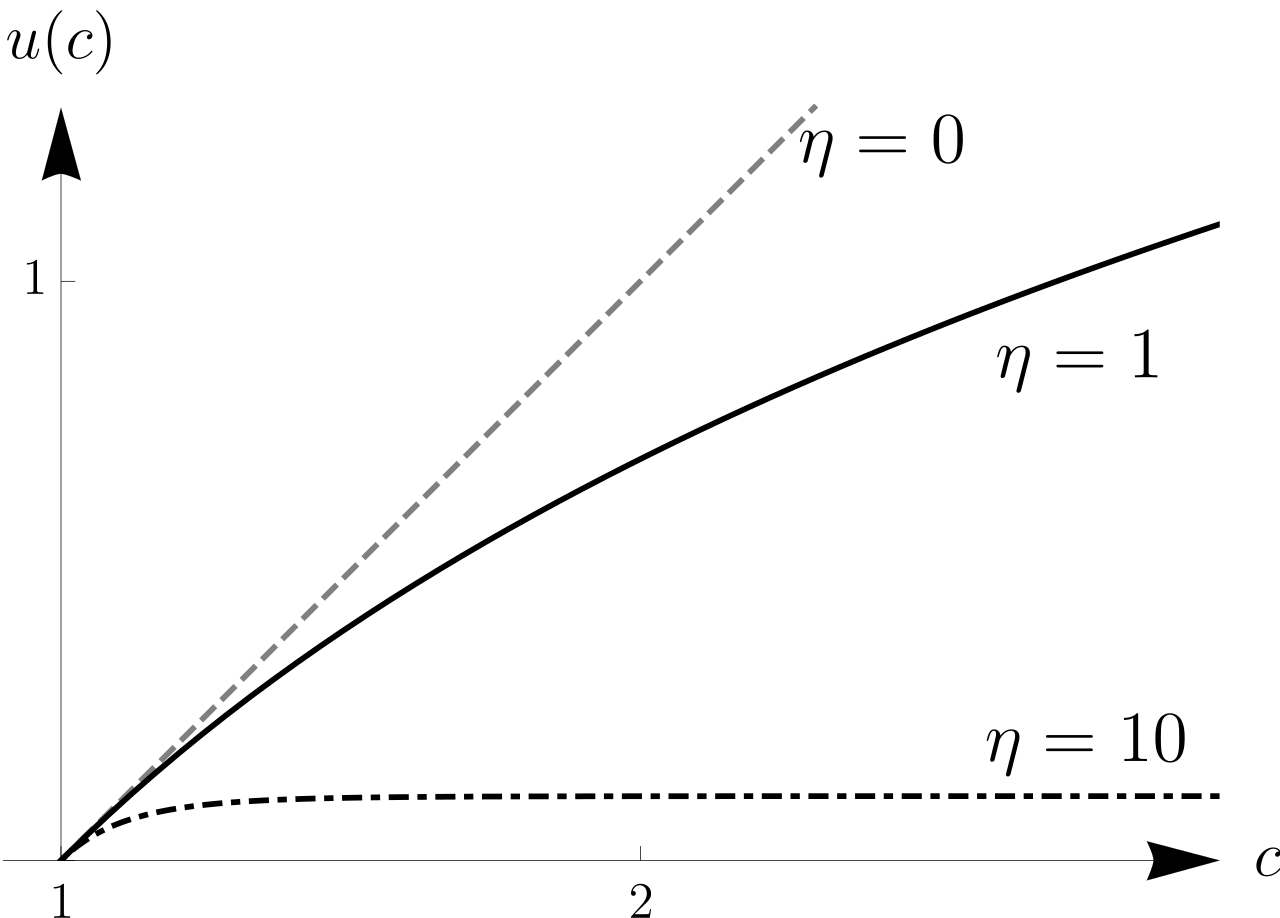
Understanding an $\eta$ of 30 with a gamble.
- 50% chance your wealth doubles
- 50% chance your wealth halves
- How much would you pay to avoid the gamble?
You would be willing to pay 49% of your wealth to avoid a 50% chance of losing 50% of your wealth.
How might a behavioural economist explain the Equity Premium Puzzle?
Terrance Odean studied individual investors:
- Tracked individual investments.
- Counted gains and losses.
- Measured proportion of gains/losses realized.
| Entire Year | December | Jan-Nov | |
| Prop. Losses Realized | 0.098 | 0.128 | 0.094 |
| Prop. Gains Realized | 0.148 | 0.108 | 0.152 |
| Difference | -0.05 | 0.02 | -0.058 |
| t-stat | -35 | 4.3 | -38 |
Apply Prospect Theory.
- What is the reference point?
- What is the source of loss aversion?
Can traditional economic analysis explain this?
- Beliefs in mean reversion: maybe under-performing stocks today will outperform next period.
- The market data does not support this.
| % Return... | 84 days out | 252 days out | 504 days out |
|---|---|---|---|
| Winners Sold | 0.47% | 2.35% | 6.45% |
| Losers Held | -0.56% | -1.06% | 2.87% |
| Difference | 1.03% | 3.41% | 3.58% |
| p-value | 0.002 | 0.001 | 0.014 |
Investors make certain behavioural mistakes due to a variety of biases/heuristics.
- Loss aversion, which produces a desire to lock in gains.
- Present bias, which obscures the costs of delaying investment (topic for another session).
- Level-k reasoning, which accounts for the group's collective rationality.