Global Economy, Markets and Strategy
Agenda
- Case: Rocket Fuel: Measuring the Effectiveness of Online Advertising.
- Value of experimentation.
- ROI in this case.
- Determining optimal experimental cluster sizes.
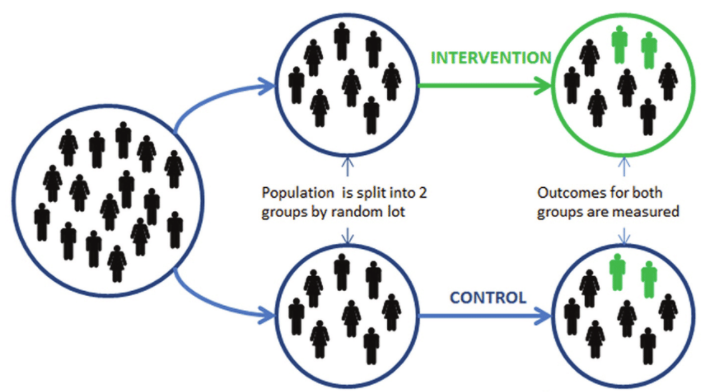
What is an experiment?
How did Rocket Fuel use an experiment to determine the effectiveness of the advertising campaign?
Experimentation
Randomization:
Random assignment of subjects ensures that there are no inherent differences between the groups answering the different questions. The differences in behavior can be attributed solely to the different questions.
Experimental Manipulation:
To learn what difference something makes in people's behavior, we vary that one thing between subjects.
Why was Rocket Fuel running an experiment for their client?
| Control | Test | TOTAL | |
|---|---|---|---|
| Did not convert | |||
| Converted | |||
| TOTAL |
Did the advertising campaign work?
How much money did the campaign generate for the client?
$ \begin{split} \text{Money Generated}\; =\; &(\text{Value of Converted User})\times(\text{Number of Exposed Users}) \\ &\times(\text{Conversion % of Exposed Users} - \text{Conversion % of Controlled Users}) \\ \end{split} $
$ \begin{split} \text{Money Generated}\; =\; &(40)\times(564577) \\ &\times(0.02555 - 0.01785) \\ \end{split} $
$ \text{Money Generated}\; =\; 173719 $
How much money did the campaign cost the client?
$ \text{Cost of Campaign} \;=\; (\text{Number of Impressions})\times(\text{Average CPM}) $
$ \text{Cost of Campaign} \;=\; (\frac{14597182}{1000})\times(9) \;=\; 131375 $
What was the ROI of the campaign?
$ \text{ROI} \;=\; \frac{(\text{Money Generated}) - (\text{Cost of Campaign})}{(\text{Cost of Campaign})} $
$ \text{ROI} \;=\; \frac{(173719) - (131375)}{(131375)} \;=\; 32\% $
What was the opportunity cost of including the control group?
Required control group size.
Following List et al. (2010):
$
\frac{n_1}{n_0}=\sqrt{\frac{c_0}{c_1}}\frac{\sigma_1}{\sigma_0}
$
where
- $n_1$ is the size of the treatment group.
- $n_0$ is the size of the control group.
- $c_1$ is the marginal cost of the treatment group.
- $c_0$ is the marginal cost of the control group.
- $\sigma_1$ is the standard deviation of the treatment group data.
- $\sigma_0$ is the standard deviation of the control group data.
Following List et al. (2010): $ \frac{n_1}{n_0}=\sqrt{\frac{c_0}{c_1}}\frac{\sigma_1}{\sigma_0} $
$c_1=\frac{9}{1000}\;\;\;\;\;\;c_0=\frac{9}{1000}+40\times0.0076925$
$\sigma_1=0.1578\;\;\;\;\;\;\sigma_0=0.1324$
$
\frac{n_1}{n_0}=\sqrt{\frac{\frac{9}{1000}+40\times0.0076925}{\frac{9}{1000}}}\frac{0.1578}{0.1324}\approx 7
$
In the case: $\frac{n_1}{n_0}=\frac{564577}{23524}\approx 24$
Key takeaways.
- Experimentation is a powerful tool for market exploration.
- There are opportunity costs to running experiments.
- These tradeoffs can be balanced with relatively simple statistics.