Global Economy, Markets and Strategy
Agenda
- MobLab: In-class Simulation.
- Behavioural Economics of Financial Decisions.
- Case: Behavioral Finance at JP Morgan.
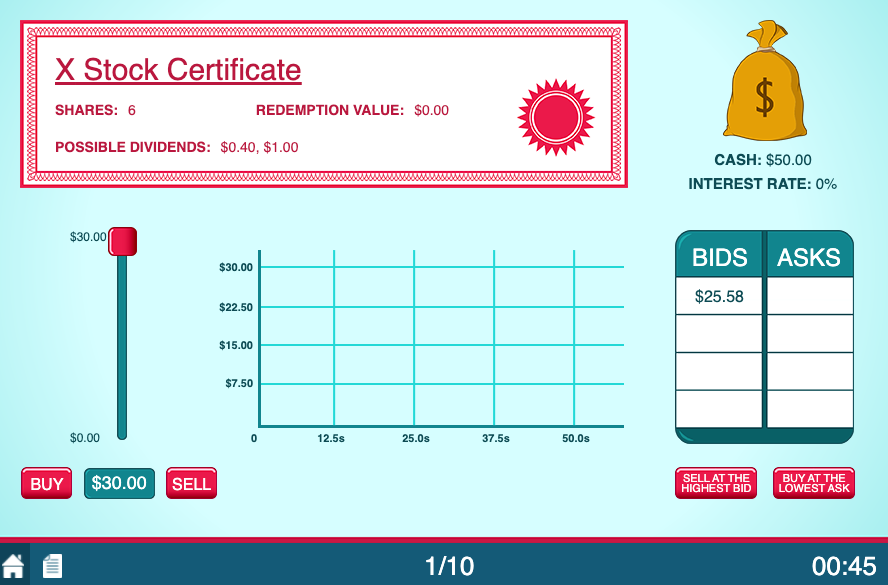
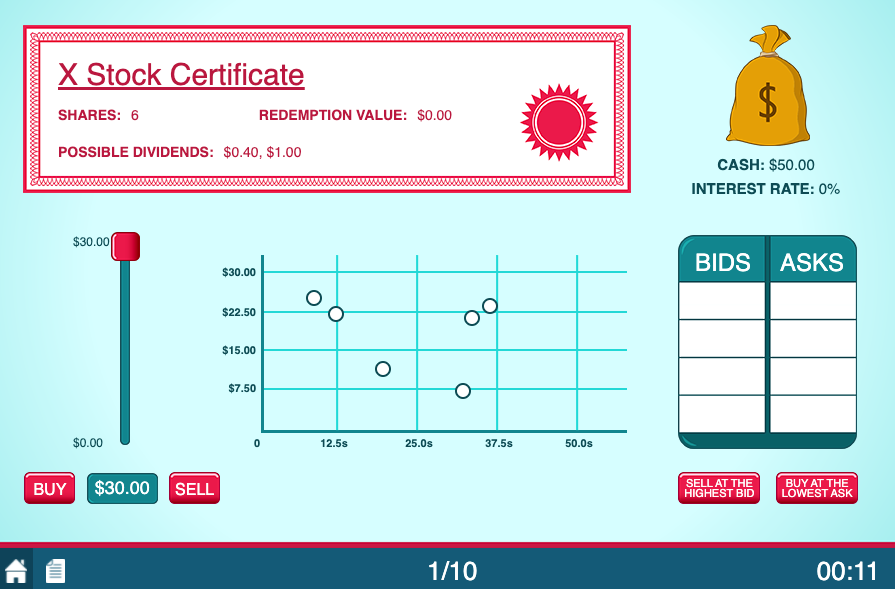
Simulation instructions.
- The situation: there is a market that trades shares of "Stock X", an asset that periodically pays out dividends to its owners.
- What you do: buy and sell shares of "Stock X" with each other over the course of 10 dividend periods to produce investment returns for yourself.
- Your objective: finish the simulation (10 periods of trading) with the most cash possible.
How it works.
- Everyone starts the simulation with 6 shares of "Stock X" and $\$$50 in cash.
- Trading begins in the first dividend period (10 total).
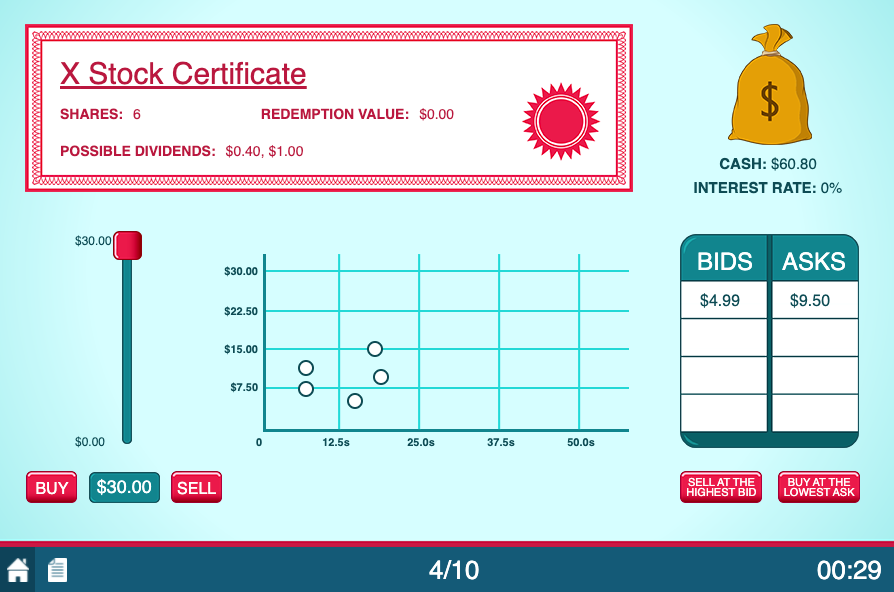
- To make an offer to buy a share of "Stock X" you will place a Bid in the market.
- To make an offer to sell a share of "Stock X" you will place an Ask in the market.
- When the computer finds a Bid$\geq$Ask in the market it will automatically trigger a trade.
How you make money.
- Dividends paid on the shares of "Stock X" you own.
- Price received on the shares of "Stock X" you sell.
How you make money.
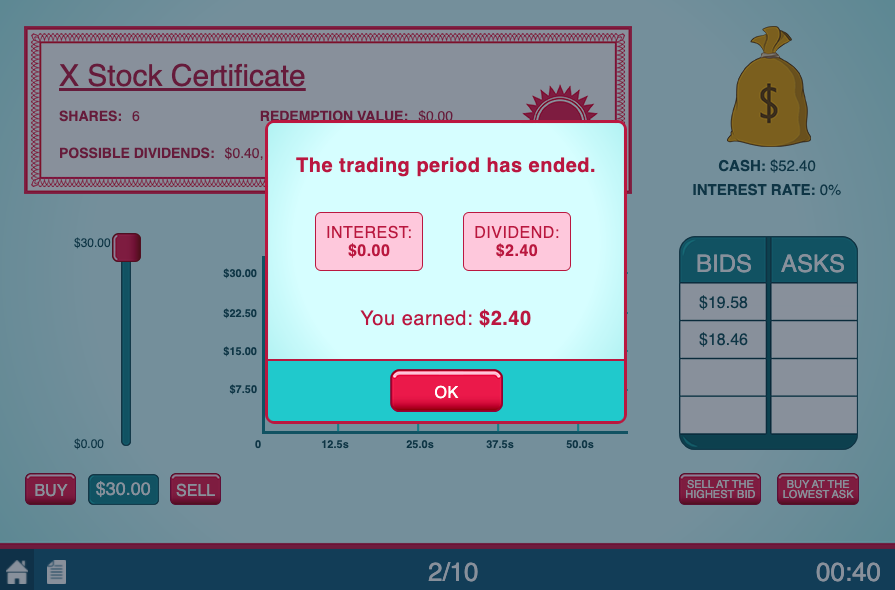
- At the end of each period, a dividend is distributed to those who own shares of "Stock X".
- The dividend will either be $\$$0.4 (50%) or $\$$1 (50%).
- Example: if you own 5 shares of "Stock X" at the end of a period and the dividend is randomly $\$$1, then you would earn $5\cdot\$1=\$5$ as a return for that period.
How you make money.
- Once dividends are paid out the next period begins and trading resumes.
- Dividends are calculated randomly once more
(either $\$$0.4 or $\$$1 per share). - This repeats for a total of 10 dividend periods, during which your returns accumulate.
Some important facts about this market.
- Shares of "Stock X" are worthless at the end of the simulation ($\$$0 redemption value).
- You may only place a Bid if you have the cash on hand, and likewise you may only place an Ask if you have a share of "Stock X" to sell.
- Each trading period lasts for 45 seconds.
To summarize:
- Everyone gets 6 shares and $\$$50 to start.
- There will be a total of 10 trading periods (45s each).
- A dividend is randomly paid out ($\$$0.4 or $\$$1 per share) at the end of each period.
- Your earnings accumulate throughout the simulation.
- "Stock X" has $\$$0 redemption value when the simulation ends.
Questions?
What is the rational pricing strategy for "Stock X"?
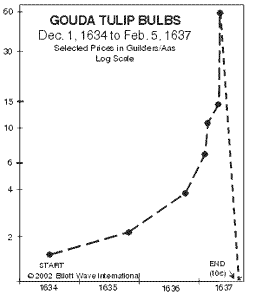
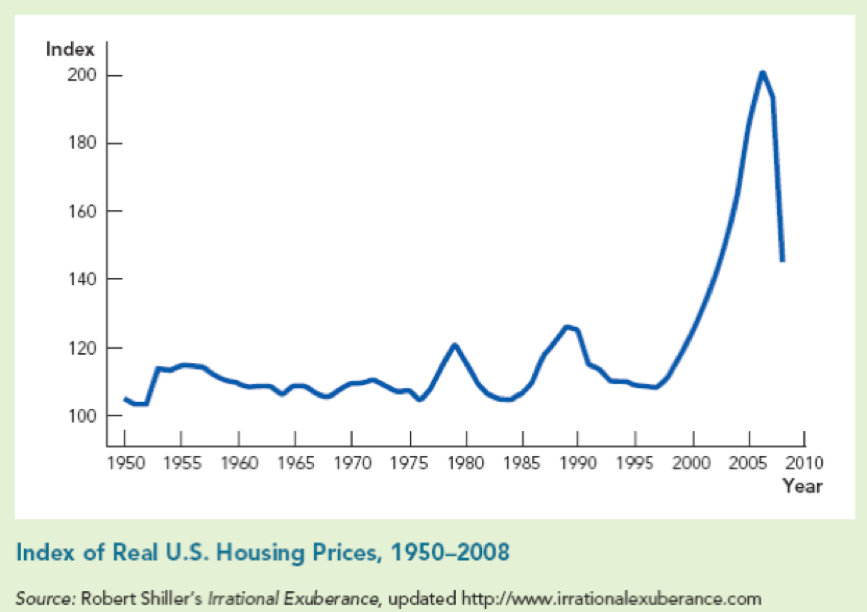
How can we relate this simulation's results to mistakes in naturally occurring asset markets?
One more MobLab Simulation.
Rule: pick a number between 0 and 100.
Winner: person who picks closest to $\frac{2}{3}$ of the group's average.
Example: if the group's average is 30, the winning number is the one closest to 20.
Level-k reasoning.
Individuals devise strategies according to their beliefs about others' rationality.
Primary assumptions regarding how financial markets operate.
| 1) | Competitive and results oriented. |
| 2) | Agents rely on all relevant information. |
| 3) | (Optional) Agents are risk neutral. |
Equity premium puzzle.
Equity returns outperformed bond returns by 4% on average from 1871-1993 (Campbell and Cochrane, 1999).
Why is this a problem?
How might a behavioural economist explain this?
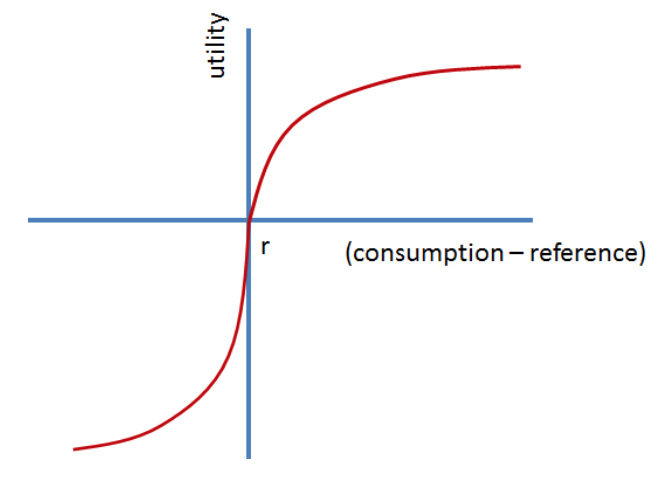
Loss Aversion.
For the consumption of something particular, people dislike losses relative to their reference point more than they like same-sized gains.
Reference points are typically formed over the person's expectations on potential outcomes.
Reference-dependent utility (Prospect Theory).
|
Reference-dependent (RD) utility depends on relative valuation.
|
Today's Major Takeaway
Evaluations of economic outcomes are heavily influenced by comparisons.
If absolute consumption is what made people happy...
- We should be happier than people 100 years ago.
- (e.g. electricity, indoor plumbing, entertainment)
Terrance Odean studied individual investors:
- Tracked individual investments.
- Counted gains and losses.
- Measured proportion of gains/losses realized (PGR,PLR).
| Entire Year | December | Jan-Nov | |
| PLR | 0.098 | 0.128 | 0.094 |
| PGR | 0.148 | 0.108 | 0.152 |
| Difference | -0.05 | 0.02 | -0.058 |
| t-stat | -35 | 4.3 | -38 |
Let's apply Prospect Theory.
What is the reference point?
What is the source of loss aversion?
Brigitte Madrian discovered another common financial mistake. Her study:
- Employer matched up to 6% of income.
- Match: $\$0.5$ for each $\$1$ contributed.
She used a natural field experiment.
- 50% of employees were automatically enrolled @ 3%.
- 50% could enroll on request after one year.
- Enrollment and contribution decisions were easily changeable (when available).
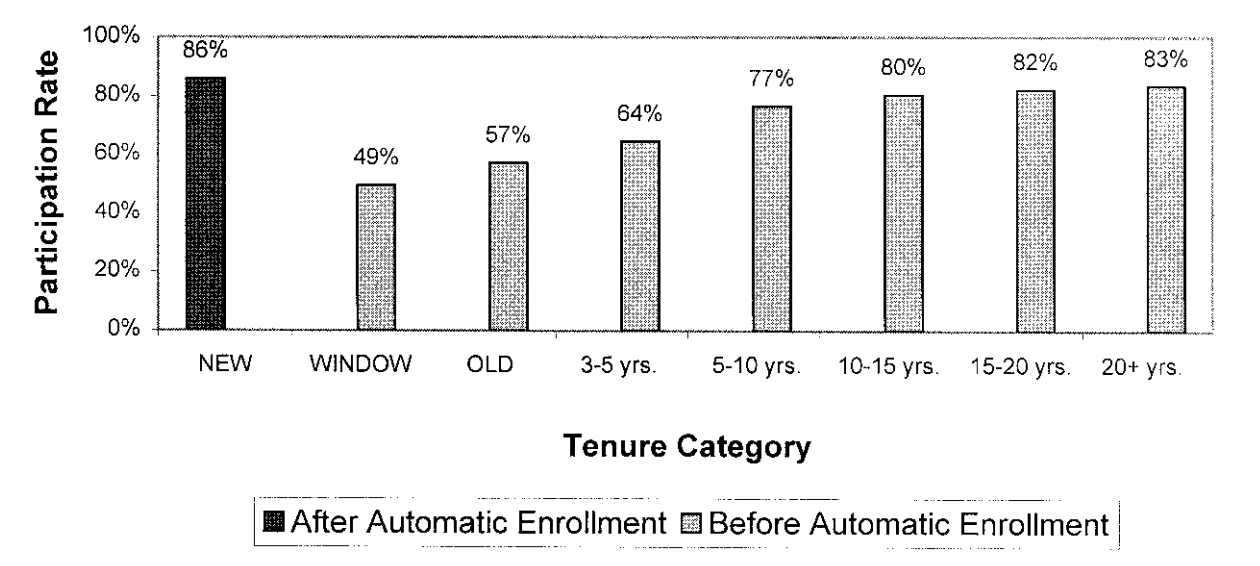
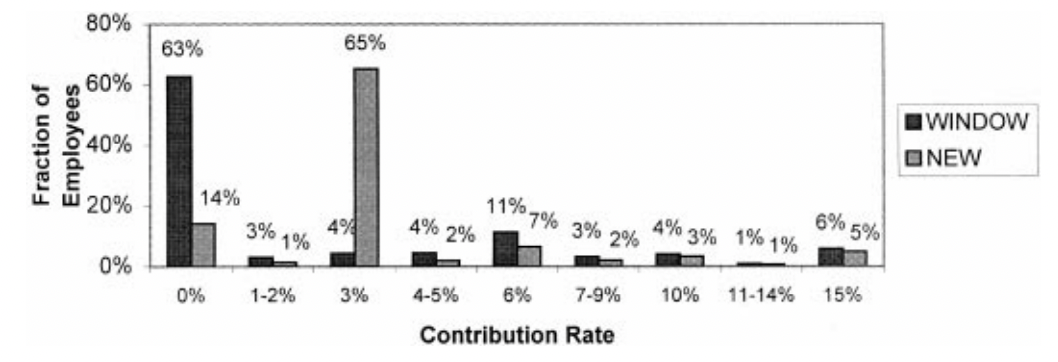
Default effect.
The tendency for individuals to avoid making an active choice by accepting the default option selected on their behalf.
The default effect is one of the most powerful tools in all of microeconomics.
What are the behavioural strategies JP Morgan managed?
How well did they perform?
What patterns in stock returns did Complin and his team find?
What biases did they attribute the patterns to?
Investors make certain behavioural mistakes due to:
- Loss aversion, which produces a desire to hold losing stocks and lock in gains when available.
- Reference points, which frame how investors evaluate investment returns.
- Level-k reasoning, which accounts for the group's collective rationality.