Auctions for Risk- Averse Charities
Joshua Foster at Ivey
Jeffrey Carpenter & Peter Matthews
at Middlebury College
Economics and Charity
Researchers surveyed 1,245 university professors from different disciplines and asked them how much money they gave to charity. Across many departments, a large percentage of professors gave to charity. In fact, only 1.1% of professors in the professional school gave nothing to charity.
What percentage of professors in the Economics Department gave nothing to charity?
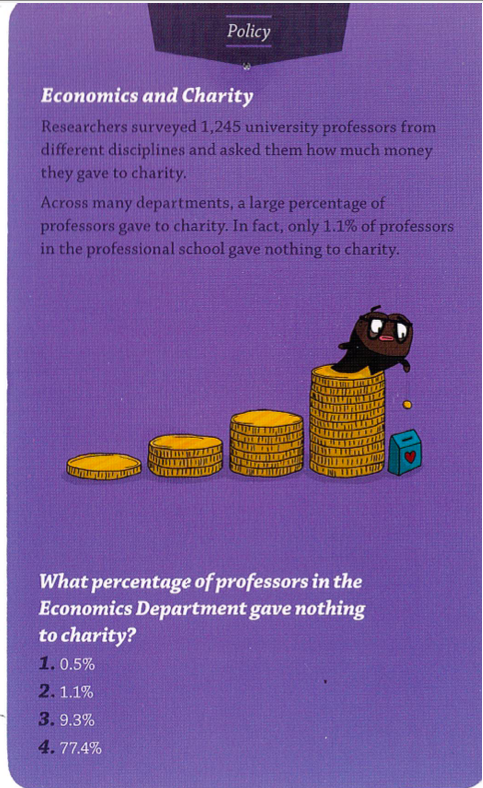
(a) 0.5%
(b) 1.1%
(c) 9.3%
(d) 77.4%
Economics and Charity
Researchers surveyed 1,245 university professors from different disciplines and asked them how much money they gave to charity. Across many departments, a large percentage of professors gave to charity. In fact, only 1.1% of professors in the professional school gave nothing to charity.
What percentage of professors in the Economics Department gave nothing to charity?
(c) 9.3%
Economics and Charity
Despite their generally higher salaries, economists tended to behave less altruistic and cooperative, donating less money to charity. In a follow-up study with students, reports of honesty were significantly lower at the end of the semester for economics students, than, for example, astronomy students.
Researchers hypothesized that this effect may have occurred because economics emphasizes the rational self-interest model of human behavior, which students then apply to their own lives.
Frank, R. H., Gilovich, T., & Regan, D. T. (1993). Does studying economics inhibit cooperation? Journal of Economic Perspectives, 7(2), 159-171.
(c) 9.3%
Outline
- Scope of Problem We Study (10 min) Fundraising is a Risky Activity for Non-profits
- Theoretical Motivation, Hypotheses (30 min) Striking Risk/Reward Tradeoff of Charity Auctions
- Experimental Design (15 min) Test 10 Auction Mechanisms, ~500 Subjects
- Results on Revenue, Participation (20 min) Robust Pattern of Predicted Tradeoffs
- Policy Recommendations (15 min) Application of Modern Portfolio Theory
Donor-based fundraising is a critical operation for most non-profits.
- Accounts for 13.3% of annual revenue, on average (McKeever, 2015).
- Produce goal-gradient behaviour among backers.
- Strengthens the participation of stakeholders.
Charity Auctions are Powerful Fundraising Mechanisms
- Several variations to choose from.
- Winner pay auctions: one bid pays.
- All pay auctions: all bids pay.
- All variations outperform voluntary contribution mechanisms (theoretically and empirically).
- Makes the act of giving a competitive process.
Bidders Receive Benefits from Revenue
- Public good benefit: each dollar of revenue produces a public good for everyone.
- "Warm glow" benefit: each dollar a given bidder gives produces a private good for themself.
The public good benefit generates a violation of the Revenue Equivalence Theorem.
Your favorite non-profit needs $\$$10,000.
Donor Community

50% chance @ 10k
50% chance @ 12k
New Wealthy Donor

10% chance @ 150k
90% chance @ 0
Your favorite non-profit needs $\$$10,000.
Winner-pay Auctions

50% chance @ 10k
50% chance @ 12k
All-pay Auctions

10% chance @ 150k
90% chance @ 0
Our focus.
- Revenue: what are the theoretical/experimental mean-variance tradeoffs between mechanisms?
- Participation: how sensitive is a mechanism's success to changes in the donor participation rate?
- Policy: what advice can we give non-profits on their fundraising design?
Theoretical
Model
Model Overview
- A risk-averse charity has non-linear preferences over auction revenue, $u(r)$.
- Risk-neutral bidders have an equilibrium bid strategy $b_m(v)$ for each mechanism $m$.
- The mechanism-induced bid strategies generate distinct revenue distributions $g_m(r)$ over revenue.
- Task: select an optimal mechanism $m^*$ according to the charity's preferences $u(r)$ and each $g_m(r)$.
Charity's Preferences Over Revenue
Assumption: charity's utility function over revenue $r$ is quadratic such that
$u(r)=r-\beta r^2$
where $\beta$ is a risk parameter.
Then, the expected utility is
$E[u(r)]=E[r]-\beta E[r^2]$.
By definition, $\mu=E[r]$ and $\sigma^2=E[r^2]-E[r]^2$.
Rearranging for $E[r^2]=\sigma^2+\mu^2$ and we find
$E[u(r)]=\mu-\beta(\sigma^2+\mu^2)$.
Assumptions on Bidders
- $n$ potential risk-neutral bidders.
- Valuations for auction item are drawn iid, $v\sim F$.
- Uniform revenue benefits.
- How well do mechanisms promote active donors?
- Bidders face a stochastic cost of $c$ to participate.
- With probability $p$, all bidders incur cost $c\geq 0$.
- Expected participation cost is $E[c]=pc$.
Endogenous Participation
Individual Rationality Condition for Participation
Net Benefits of Participating
$\geq$
Net Benefits of Not Participating
Expected Surplus from
Winning Item $(\mathbf{+})$
Warm Glow Benefit
From Own Bid $(\mathbf{+})$
Expected Public Goods Benefits (Including Own Bid) $(\mathbf{+})$
Expected Public Goods Benefits
(Not Including Own Bid) $(\mathbf{+})$
Expected Participation
Cost $(\mathbf{-})$
Experimental
Predictions
The Mechanisms We Study
First-price Winner-pay
Sealed bid, Dutch
Second-price Winner-pay
Sealed bid, English, Silent
First-price
All-pay
Sealed bid
Second-price All-pay
All-pay Button, "Bucket"
Last-price
All-pay
Sealed bid
Standard Lottery
Raffle
Prediction 1: Mechanisms with greater expected revenue also have greater revenue variance.
Prediction 2: All-pay revenue variance will increase as the cost of participation decreases, while winner-pay revenue variance will decrease.
(Aside from the Raffle, which is already kind of a weird mechanism.)
Prediction 3: Participation rates will not vary significantly by mechanism.
(Although there is a slight advantage for the Raffle and Second-price Winner-pay.)
Experimental
Design
Experimental Design Overview
Tested 10 mechanisms with 5 sessions each.
10 potential bidders and 10 auctions per session.
Charity-based benefits imposed on auction revenue.
Phase 1: Earn Money
- 18 incentivized anagram puzzles.
- Difficulty exogenously varied.
Phase 2: Bid or Anagram
- Participate in an auction.
- Attempt another anagram of known difficulty.
Phase 1 Examples: An Easy One (1 of 5)
Reward for solving: 10 ECUs
WCO
Phase 1 Examples: A Hard-ish One (4 of 5)
Reward for solving: 10 ECUs
AAREMC

Phase 2 Example: FPWP (Sealed-bid)
Auction #1 (of 10)
Budget: 140 ECUsYour Auction Prize: 85 ECUs
Anagram difficulty level: 1 of 5 (easy)
Attempt
Anagram
Submit
Bid
Phase 2 Example: FPWP (Sealed-bid)
Auction #2 (of 10)
Budget: 140 ECUsYour Auction Prize: 12 ECUs
Anagram difficulty level: 3 of 5 (intermediate)
Attempt
Anagram
Submit
Bid
Experimental Results
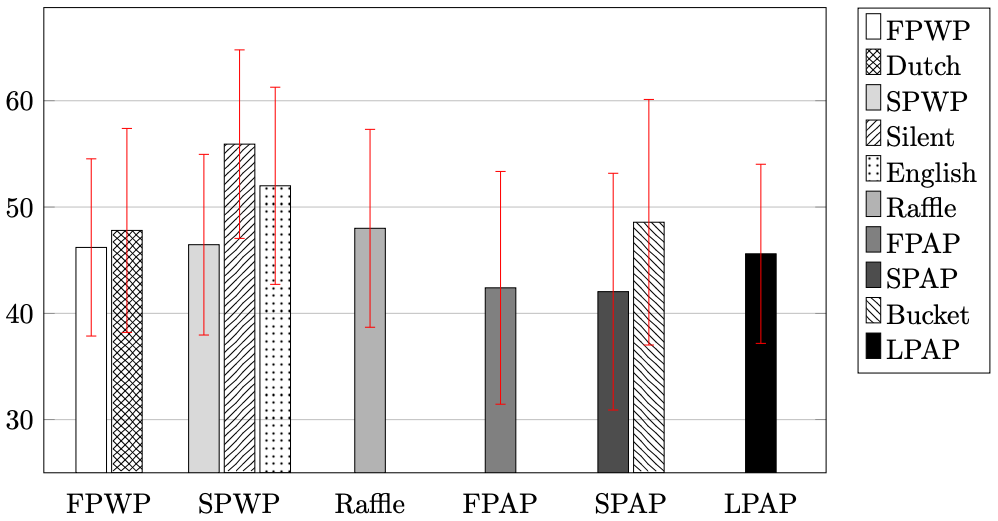
Average Revenue by Mechanism

Mean-variance Tradeoffs

Mean-variance Tradeoffs

Model: Frontier (one-sided error), mechanism-level.
Result 1: Nearly all mechanisms with greater expected revenue also have greater variance.
Average Participation Rate (%)
Participation Attrition (Marginal Effects)
Model:Probit, subject-level.
Result 2: As predicted, participation rates were similar across mechanisms.
However, all-pay mechanisms experienced more attrition than winner-pay mechanisms.
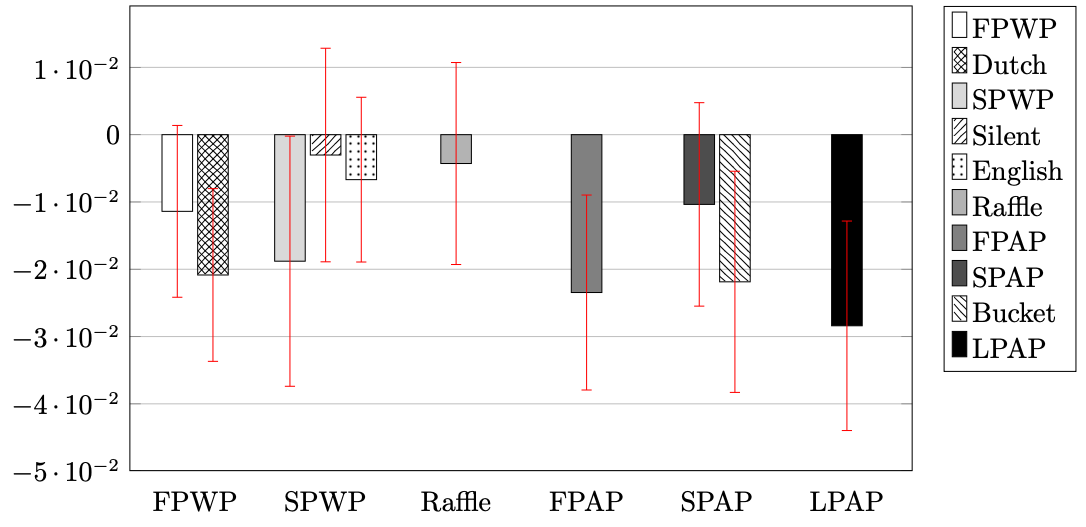
Participation & Revenue Variance by Puzzle Difficulty
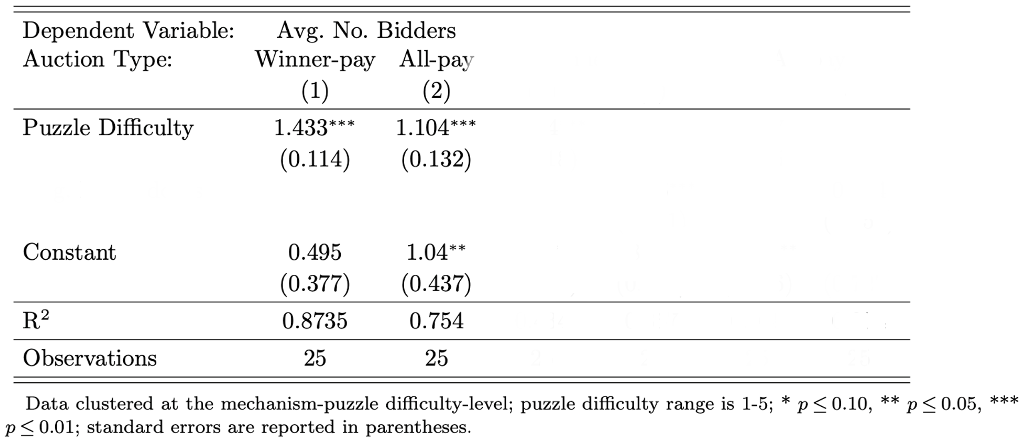
Model:OLS, mechanism-puzzle difficulty-level.
Participation & Revenue Variance by Puzzle Difficulty
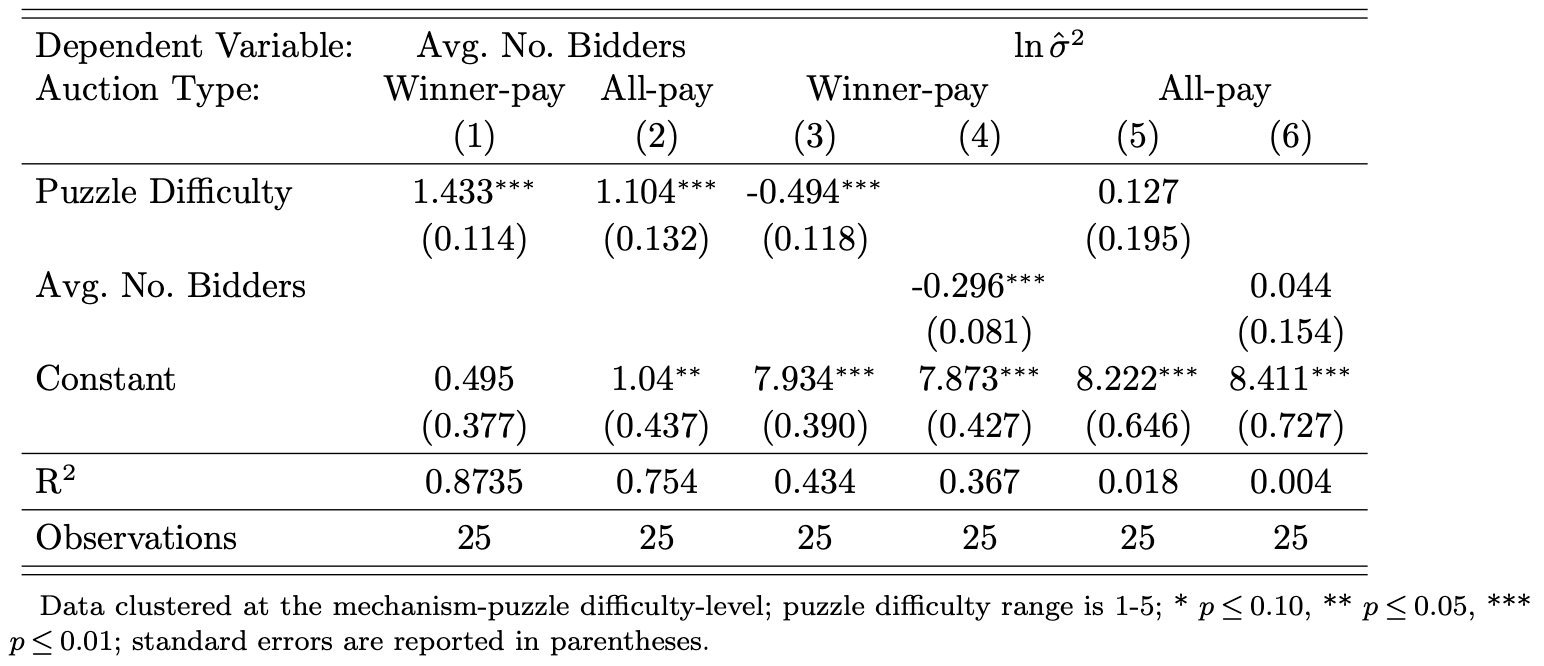
Model:OLS, mechanism-puzzle difficulty-level.
Result 3: As predicted, a decrease in participation costs yielded more revenue variance for all-pay mechanisms, but less variance for winner-pay mechanisms.
Fundraising Design
and
Risk Management
Application of Modern Portfolio Theory
- Evidence for risk-reward tradeoffs among fundraising mechanisms.
- Theory provides a structural foundation for mechanism (co)variances of revenue.
- Straight-forward to implement a 'portfolio' of fundraising mechanisms in practice.
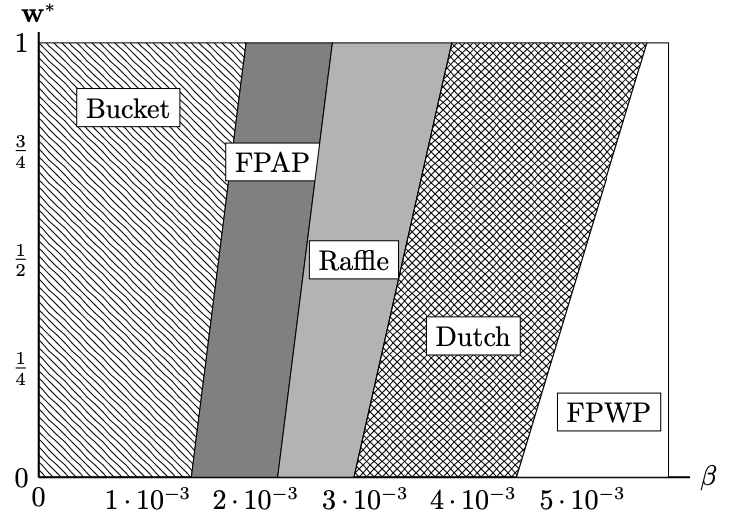
Optimization Problem
$\max_{\mathbf{w}}\;E[u(\boldsymbol{\mu},\boldsymbol{\sigma}^2\mid\beta)]=\mathbf{w}^\text{T}\boldsymbol{\mu}-\beta\left(\mathbf{w}^\text{T}\boldsymbol{\sigma}^2+(\mathbf{w}^\text{T}\boldsymbol{\mu})^2\right)$
$\text{s.t.}\;\;\mathbf{w}^\text{T}\mathbf{1}=1$ and $0\leq\mathbf{w}$
Solved via quadratic programming using experimental data.
Areas for Future Research
- Sellers' non-risk-neutral preferences over revenue is vastly under-studied in auction theory.
- Exploration of other risk management strategies (e.g. shortfall analysis).
- Many auction environments with interesting sub-problems (e.g. for-profit settings, sequential auctions, complementarities).

Calculating Mean and Variance of Revenue
Ex ante expected payment $E[p_m]$ in mechanism $m$:
$E[p_m]=\int_{\hat{v}_m}^{\overline{v}}b_m(v)dF_m(v)$
With $n$ bidders, expected revenue is $\mu_m=nE[p_m]$.
Variance of a bidder's payment:
$\text{Var}(p_m)=\int_{\hat{v}_m}^{\overline{v}}b_m(v)^2dF_m(v)-E[p_m]^2$
Variance $\sigma_m^2$ of mechanism $m$:
$\sigma_m^2=\text{Var}\left(\sum_{i=1}^n p_m^i\right)$
$=\sum_{i=1}^n\text{Var}(p_m^i)+2\sum_{i\leq j}\text{Cov}(p_m^i,p_m^j)$